
Crypto Trading Strategy
How to read the market


All the price charts in the financial market reflect human psychology like fear and greed. You always have to handle the noise that comes from the psychology when you try to be profitable in the market. However, if you look carefully to the every candlestick, there will be footprints of traders psychology and that's why the price action always be the best indicator. In this article, I will explain how to read the market sentiment.
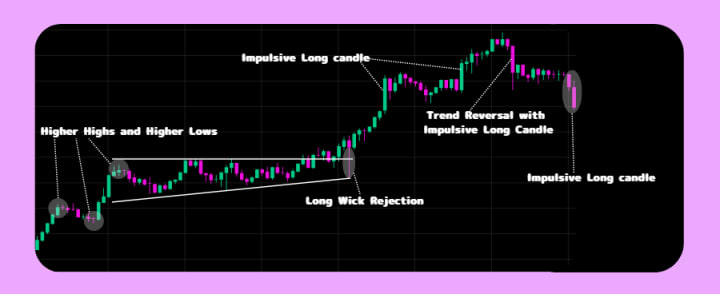
Let's think about the bullish trend chart like the ones above. As I mentioned earlier, pure chart patterns tell you the trader's psychology behind the market activity.
For example, you can see the higher highs and higher lows in the beginning before the price consolidates in the chart. That clearly indicates that buyers are dominant and buy orders form the bullish trend. In this phase, you can draw a trend line by connecting the highs and lows. That's the basic of the trading and the market is not always that simple.
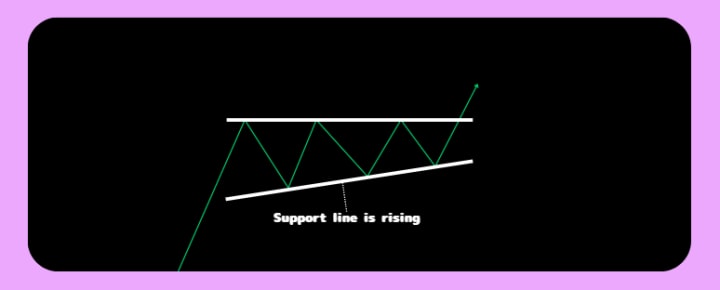
After the simple movement, the market enters consolidation in the example chart above. More noise comes into the market and this is where a lot of traders get lost as the price movement becomes complicated. However, if you take a step back and look at the big picture, you can see the support and resistance line like shown in the picture. In other words, short-term trading has a lot of noise but if you zoom out enough, your win rate will improve. Actually the essence remains the same as the trend line. The only difference is whether the key levels are horizontal or diagonal. All you have to do is just to find support and resistance levels.
You might have already noticed, but the support line of the consolidation is slightly rising in the picture. That is also important because that implies more buyers are accumulating than sellers indicating possible bullish continuation in the near future.
After the breakout from the consolidation area, there is a long lower wick candle in the example chart. This means a sudden bearish movement rejected right after it occurred and back to the trend. This is also a strong trend continuation pattern. The wick is even rebounded on the rising support line proving strong buying pressure exists on the support.
Important patterns still exist around the final phase in the example chart. As it is written in the picture, there are impulsive long candlesticks. These sudden long candlesticks mean a sudden spike in sentiment. It could possibly occur during a trend or at its peak. If an impulsive bullish long candle occurs during a bullish trend, it will fuel the trend. On the other hand, if an impulsive bearish long candle occurs during a bullish trend, the trend is likely at its peak and a trend reversal is soon to follow.
It is also important to always analyze the chart across multi-timeframes. Shorter timeframes have more details but more noisy and longer timeframes have less noise but less details. By combining shorter timeframes and longer timeframes, you will be able to analyze the market structure precisely.
You can apply same analysis to all timeframes. Price chart has fractal structure meaning all timeframes have similar features. I recommend you to use 3 timeframes. For example, you might pick daily chart as a long timeframe, 1hour chart as a middle timeframe and 15mins chart as a short timeframe.
By using those 3types of timeframes, you can set target price level by long timeframe, capture the market structure by middle timeframe and catch the first move of the trend precisely by short timeframe.
About the Creator
Shama Crypto Trading & Investing
Sharing financial market news, topics and analysis.
Keep reading
More stories from Shama Crypto Trading & Investing and writers in Trader and other communities.
Australia Air Freight Market: A $3.7 Billion Logistics Backbone Accelerating Global Trade
The Australia air freight market is rapidly gaining momentum as a critical pillar of the country’s logistics and trade ecosystem. According to IMARC Group, the market was valued at USD 2.0 Billion in 2025 and is projected to reach USD 3.7 Billion by 2034, expanding at a CAGR of 7.12% during 2026–2034.
By Rashi Sharma6 days ago in Trader
The Irony of Flying While We Bomb the "World's Greatest Terror Regime"
Ah, the irony of flying at this moment in time as the United States is simultaneously bombing Iran - the nation officials have insisted for decades is "The World's Greatest Terror Regime" - while the TSA is on a go-slow, courtesy of a funding squeeze that's left its officers unpaid, quitting in droves, and turning checkpoints into something like slow-moving bread lines.
By Scott Christenson🌴8 days ago in Humor


Comments
There are no comments for this story
Be the first to respond and start the conversation.